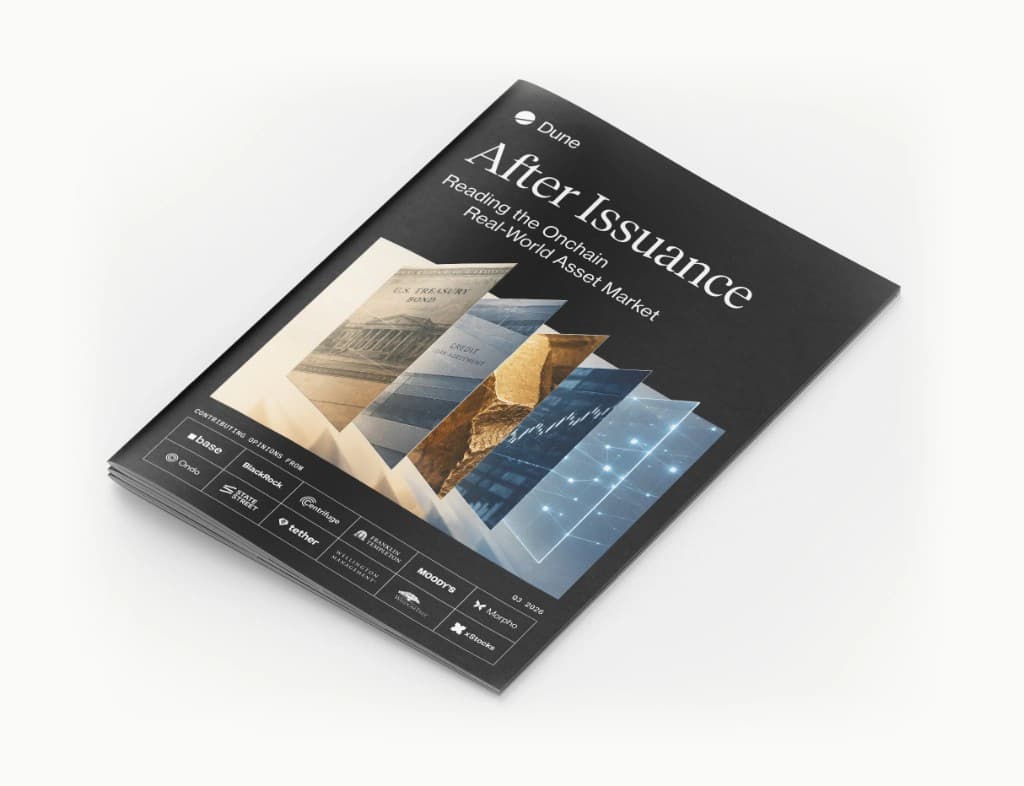
A full view of how much value in traditional assets now lives onchain, how it is used, and whether it tells you something the offchain market doesn't.
Get the reportIssuers and platforms in the data
Tokenized assets by class, month end
01 · Supply
The four asset classes grew more than 140% in a year, to $33.9bn
Cash equivalents make up about half the market. Equities are the smallest class, but they grew the fastest and account for most of the trading.
$17.8B
In cash equivalents, the largest class
25×
Growth in tokenized equities in a year
93%
Share of August spot trading in equities
Money funds: 90-day realised yield · Treasuries: 31 August 2026
02 · Cash equivalents
Tokenized cash sits almost entirely at the short end of the curve
Money funds and T-bills make up almost all of it, and they rarely trade. Views on rates and inflation are expressed in longer bonds, which have drawn very little capital onchain.
95%+
Of tokenized Treasury exposure is T-bills and money funds
0.006%
Of cash-equivalent supply traded in August
Tokenized gold, change over the year
03 · Gold
Tokenized gold is growing mainly because investors hold more of it
Ounces held rose 73% over the year, well ahead of the 29% rise in the gold price. Central banks have been adding to their gold in the same way, on a far larger scale.
+73%
Ounces of tokenized gold held
36t
Tokenized gold, 0.86% of the gold held in ETFs
Share of each class in lending protocols, 31 August 2026
04 · Credit
Credit is the asset most used as collateral onchain
About a fifth of tokenized credit sits in lending protocols, compared with almost none of the cash equivalents. In traditional markets, government bonds are the usual collateral.
19–21%
Of tokenized credit in lending protocols
0.4%
Of cash equivalents in lending protocols
Share of exposure, August 2026
05 · Oil
Onchain oil exposure is almost all in perpetuals
Oil perpetual positions turn over about three times as fast as gold's, and trading tends to pick up around price moves and major events.
98%
Of onchain oil exposure is in perpetuals
$109M
Traded on Iran-conflict prediction markets in August
SK Hynix perpetual open interest, July–August 2026
06 · Equities
The SK Hynix perpetual showed how crowded the AI memory trade had become
Memory chip makers are the largest AI trade onchain, and SK Hynix leads it. The contract trades around the clock, so that positioning was visible even while the Korean market was closed.
308%
Peak annualised funding to stay long, 30 July
47%
Of August equity perpetual volume was memory names
Featuring expert perspectives from
Read the full report
It covers cash equivalents, credit, commodities and equities in depth: who holds them, how they trade, what they pay and how they are used.
The download will be sent via email
What the report is built on
Registry
Every token on every chain
Issuer, platform, legal wrapper, regulator, jurisdiction, custodian, transfer agent, LEI and CIK.
Supply & holders
Who owns it, and where
Daily supply and balances with labelled addresses: exchanges, lending protocols, DEX pools, custodians, minters.
Pricing & NAV
Prices, NAV and yield
Oracle prices, NAV history and validity intervals, so realised yield is measurable per product.
Trading
Spot and synthetic together
Onchain spot trades, Hyperliquid perpetuals and prediction markets: volume, open interest and funding by market.
Lifecycle
Mints, redemptions, transfers
Supply changes classified by event type, so primary issuance separates from secondary movement.
Freshness
New issuance within the week
Roughly 95% of assets appear within a week of issuance.
Access the RWA dataset for your own analysis
Every table behind this report is available on Dune: the product registry, balances, prices and NAV, lending deposits, spot trades and Hyperliquid perpetuals.