Faster,Shorter,MoreAutomated:AnatomyofPolymarket'sFastestMarkets
An on-chain deep dive into Polymarket's fastest crypto markets: volume, automation, and fee economics.
Research•April 14, 2026•9 min read

Filippo ArmaniData Content Creator at Dune
This analysis uses on-chain data from Dune, covering Polymarket's fast markets from their launch in September 2025 to March 30 2026. All datasets referenced in this analysis are available on Dune — via the app, API, or Datashare.
For enterprise access to Polymarket trade, fee, and market structure data, speak to us.
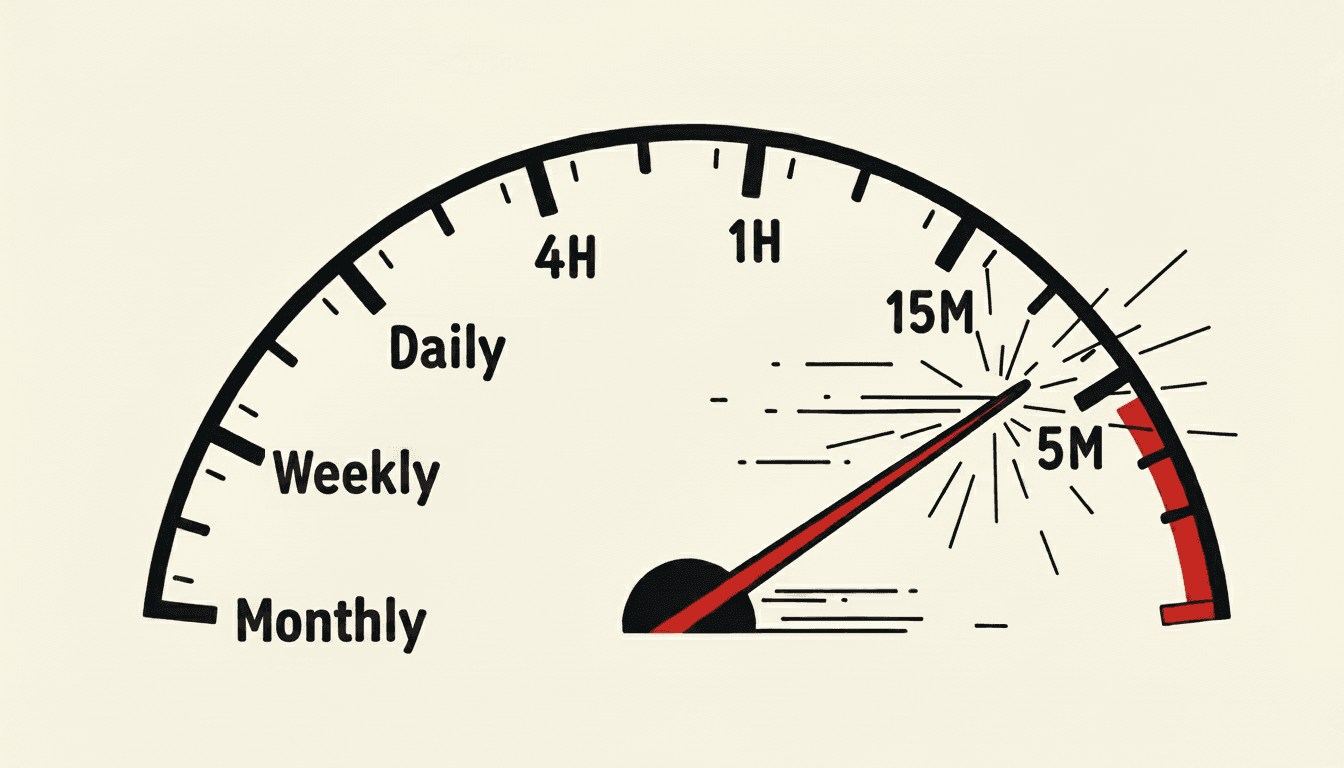
Polymarket's fast crypto markets launched with 15-minute contracts in September 2025 and hourly contracts around the same time. These products started small — accounting for less than 10% of total Polymarket volume in their first weeks — but grew steadily, reaching roughly 20–25% of platform-wide volume by early 2026. The 15-minute product alone reached $292M in weekly notional volume by February 2026. Then Polymarket launched 5-minute markets, and within two weeks, they overtook the 15-minute volume entirely.
The shift was partly cannibalistic. In the week of February 9 (the first full week with 5-minute markets), 15-minute volume was $260M. One week later, it had dropped to $143M, a 45% decline. Much of that volume migrated to 5-minute markets, which immediately surged to $258M. By the week of March 2, 5-minute markets peaked at $385M while 15-minute settled at $126M. Overall fast market volume continued to grow, suggesting the shorter duration attracted new activity alongside the migration, but the 15-minute product clearly lost its position as the default.
Most striking: over the Feb 15–Mar 30 window, 5-minute markets generated nearly 3x the notional volume ($2.3B) of 15-minute markets ($795M), despite being live for only 8 weeks versus 7 months.
Across all fast market durations, Bitcoin is the overwhelming driver of volume, accounting for roughly 77% of weekly fast market turnover ($410M out of $532M in the week of March 23).
Ethereum is a distant second at ~13%, with Solana and XRP each contributing ~5–6% after launching in late October and growing steadily to $28M and $19M per week by late March. Newer additions like Dogecoin, BNB, and Hyperliquid remain marginal for now — they launched only days ago, and market makers, bots, and traders are still adjusting strategies and deploying liquidity to these thinner books.
While still a minor share of total Polymarket's volume, within crypto-only markets, the picture is dramatic. Fast markets (5-min + 15-min + hourly + 4H/daily/weekly Up/Down contracts) went from ~40% of crypto volume in September 2025 to over 80% by March 2026. Some of this growth came at the expense of longer-duration crypto products — "Other Crypto Markets" (hit-price, above/below, multi-day contracts) held relatively flat at $90–$190M per week — though overall crypto volume also expanded.
The volume breakdown by asset and duration is powered by polymarket_polygon.market_trades and polymarket_polygon.market_details — updated daily on Dune. Integrate into your workflows via app, API, or Datashare. Speak to us for enterprise access.
Bloomberg reported that "shortened trading windows tend to reward those utilizing automation" and that "a human tapping a phone screen cannot compete with software calibrated to exploit tiny price discrepancies in milliseconds." The on-chain data confirms this — and reveals a clear gradient: the faster the market, the higher the bot concentration.
We classified every taker address over a 30-day window (Feb 15 – Mar 15) by trading frequency, active days, and hours-of-day coverage — excluding all Polymarket system contracts (CTF Exchange, Neg Risk Exchange, Adapter, Conditional Tokens, and wallet factories). We then split the results by market duration.
The numbers by market type

The pattern is clear. In 5-minute and 15-minute markets, automated addresses (heavy bots trading 10K+ times across 20+ days and 20+ hours, plus active bots at 1K+ trades) control 55–62% of volume, while casual and regular traders contribute only 4–5%. In hourly markets, bots still lead at 45% but casual traders get a meaningful 26%, much more retail-friendly. In 4H/daily/weekly markets, bots drop to 31% and casual + regular traders are the largest group at 41%.
The 15-minute market having a higher bot share (62%) than the newer 5-minute market (55%) likely reflects maturity: bots have had six months to optimize 15-minute strategies, while 5-minute markets launched only five weeks before the measurement window. The "frequent traders" bucket (100+ trades, 40% of 5-min volume) likely includes semi-automated users and emerging bots that haven't yet hit the higher thresholds.
Trade sizes scale with market speed across all trader types. Bots average $6–7 per trade on 5/15-minute markets, rising to $35 on 4H+ markets. Casual traders follow the same gradient but at a higher level: $15–25 on fast markets, $60–137 on slower ones. The difference is frequency: bots compensate for tiny bets with millions of trades, while casual traders place fewer but larger positions. In 5-minute markets, 6,189 bot addresses generated 56 million trades; 43,898 casual addresses generated just 166,000.
Polymarket's Builder Program includes 231 registered third-party integrations — trading bots, Telegram and Discord interfaces, and automated trading apps — that route users to Polymarket's order book via the CLOB API. Users trade from their own wallets, but builder tools shape their behavior: a Telegram bot that prompts "BTC up or down?" and executes in one tap naturally produces high-frequency, small-size trades indistinguishable from pure automation. Builder volume has grown steadily week over week, and given the nature of these integrations, a significant share likely flows into fast crypto markets.
The trader classification behind this analysis — address-level bot detection, trade size distributions, and activity patterns — is built on polymarket_polygon.market_trades. Available via Dune's app, API, and Datashare. Speak to us for enterprise access.
On January 7, 2026, Polymarket introduced taker fees for the first time. Initially, fees applied exclusively to short-duration crypto "Up or Down" contracts and select sports markets (NCAAB, Serie A). But in late March, Polymarket expanded fees significantly — adding La Liga soccer, Elon Musk tweet markets, and other high-velocity categories. The fee base is no longer just crypto fast markets.
Crucially, these fees are not purely extractive. Taker fees are partially redistributed to liquidity providers through a maker rebates program, alongside additional liquidity incentives. This creates a built-in mechanism to reinforce depth and tighten spreads, aligning revenue generation with improved market quality.
In just 83 days (Jan 7 – Mar 30), Polymarket has generated $23.7M in net fee revenue, averaging $286K per day (~$104M annualized). Of this, approximately 20–25% is redistributed to market makers as daily USDC rebates, with the remainder retained by the protocol.
Bitcoin remains the largest fee contributor at $13.7M (58% of total), with Ethereum at $2.4M (10%) and Solana and XRP combining for $1.6M. But the story has shifted. NCAAB surged to $1.5M — driven by a March Madness spike that saw the week of March 16 alone generate $652K in basketball fees. And a new "Other" category — La Liga soccer, tweet markets, and other recently added fee markets — exploded to $4.4M in the week of March 30 alone, instantly becoming the second-largest category after Bitcoin.
This expansion matters. Through mid-March, Bitcoin 5-min and 15-min markets accounted for over 70% of all fee revenue. By the end of March, that concentration had dropped as new fee markets came online. Polymarket appears to be systematically rolling out fees across its highest-velocity products — crypto first, then sports, now culture and politics markets.
Within crypto, the fee dynamics mirror the volume story. Since 5-minute markets launched in early February, they have generated more fee revenue than 15-minute markets every single week, peaking at $2.1M in the week of March 30 — the largest single-week crypto fee haul to date, likely driven by crypto volatility. Hourly and 4-hour markets contribute under 4% of crypto fees combined.
The fee flywheel is working: velocity generates fees, fees fund maker rebates, rebates tighten spreads, tighter spreads attract more velocity. And it's no longer just a crypto flywheel — the expansion to sports and culture markets suggests Polymarket is building a fee infrastructure that could eventually apply to any market with sufficient trading velocity.

Across crypto markets, fee revenue is split almost evenly between 5-minute and 15-minute contracts — 52% and 44% respectively — with hourly and longer-duration markets contributing under 4% combined. Notably, 5-minute markets have already overtaken 15-minute in cumulative fees ($9.3M vs $7.9M) despite launching five months later. Since going live in early February, 5-minute markets have generated more fee revenue than 15-minute markets every single week, peaking at $2.1M in the week of March 30. The pattern mirrors the partial volume cannibalization from Section 1: 5-minute markets didn't just take volume from 15-minute ones, they took the fee revenue too.
Revenue concentration becomes even clearer at the market level. Just two products — Bitcoin 5-minute and Bitcoin 15-minute markets — account for 72% of all crypto fee revenue, with BTC 5-minute alone generating $9.3M, more than Ethereum, Solana, XRP, and all other crypto assets combined. Adding Ethereum 5-min and 15-min brings coverage to 86% across just four market types.
In 83 days, crypto fast markets generated $17.8M in fee revenue — and that's before counting the recent expansion to sports and culture markets, which pushed total platform fees to $23.7M ($286K/day, ~$104M annualized). The fee flywheel is working: velocity generates fees, fees fund maker rebates, rebates tighten spreads, tighter spreads attract more velocity. And it's no longer just a crypto flywheel — in late March, Polymarket expanded fees to La Liga soccer, Elon Musk tweet markets, and other high-velocity categories, nearly doubling weekly fee revenue overnight. Whether this diversification reduces the platform's dependence on Bitcoin remains the key question: as of today, BTC 5-minute markets alone still generate more fee revenue than every non-BTC crypto market combined.
Fee economics powered by Polymarket's decoded on-chain fee module events (feemodule_evt_feerefunded, negriskfeemodule_evt_feerefunded) on Dune — tracking every fee charged and refunded at the transaction level. Available via app, API, and Datashare. Speak to us for enterprise access.
Seven months of on-chain data paint a consistent picture. Polymarket's fast markets are getting faster (5-minute overtaking 15-minute in weeks), more automated (55–62% bot volume), more concentrated (Bitcoin alone drives ~77% of both volume and crypto fee revenue), and increasingly profitable — $23.7M in total fee revenue in just 83 days, with a flywheel that reinvests into liquidity through maker rebates. Every metric points in the same direction: a product that started as a prediction market experiment is converging on the structural profile of a derivatives exchange — short durations, algorithmic participants, maker-taker fee models, and revenue tied to trading velocity rather than informational value.
The convergence is happening from both sides. Polymarket keeps compressing resolution times and expanding its fee base, while perps platforms like Hyperliquid and dYdX move toward more structured products and fixed-duration contracts. The recent fee expansion beyond crypto is perhaps the clearest signal: Polymarket is no longer just monetizing a crypto trading product, it's building a fee infrastructure for any market with sufficient velocity.
For now, the prediction market label still matters, as it determines the regulatory regime, the fee structure, and the user perception. But the on-chain data shows that the product has already crossed the line.
Data sources. This analysis draws on three layers of Polymarket data on Dune. For volume and market classification, we use the Polymarket curated tables: polymarket_polygon.market_trades (trades with price, amount, shares, maker/taker addresses) and polymarket_polygon.market_details (market metadata including tags, questions, and resolution times). For fee revenue, we go directly to the decoded contract event tables: polymarket_polygon.feemodule_evt_feerefunded and polymarket_polygon.negriskfeemodule_evt_feerefunded (actual fee charges from the on-chain fee module), supplemented by polymarket_polygon.ctfexchange_evt_orderfilled and polymarket_polygon.negriskctfexchange_evt_orderfilled (order fill events used to derive daily Volume-Weighted Average Price for converting share-denominated fees to USDC).
Market classification. Fast markets identified via "Up or Down" tag in market_details. Duration classified by strict tag matching: "15M" first, then "5M" (excluding 15M), then "1H"/"Hourly". Asset classification by question prefix (Bitcoin→BTC, Ethereum→ETH, etc.).
Volume methodology. All volume figures report taker notional volume — the number of shares traded on the taker side. In Polymarket's CLOB, each fill has a taker and a maker. The Spellbook's market_trades table records each fill as one row. We filter to rows where taker IN (CTF Exchange 0x4bFb...982E, Neg Risk Exchange 0xC5d5...f80a) and sum the shares field. Notional volume counts the number of shares exchanged (e.g., a $10 bet at $0.50 price = 20 shares = $20 notional). This is the standard Polymarket volume metric. Considering the taker side only avoids double counting, as described by Paradigm.
Bot classification. Taker addresses classified over Feb 15–Mar 15 by trade count, active days, and hours-of-day coverage. Heavy bots: 10K+ trades, 20+ days, 20+ hours. Active bots: 1K+ trades, 10+ days. Polymarket system contracts excluded: CTF Exchange (0x4bFb...982E), Neg Risk Exchange (0xC5d5...f80a), Adapter (0xd91E...5296), CTF (0x4D97...6045), factories (0xaacf...1b, 0xaB45...052). Cross-referenced with Builder Program data for validation.
Fee methodology. Net fee revenue sourced from FeeRefunded.feeCharged — the actual fee kept by the protocol after refunds. Share-denominated fees priced via same-day VWAP from OrderFilled events. Fee breakdown by asset and duration uses proportional allocation of net totals based on each category's share of gross fees. Note: the "Other" category in late March reflects Polymarket's expansion of fees to new market types (La Liga, tweet markets, and others) not yet mapped in our classification query.
Period. Sep 2025–Mar 30, 2026 for volume. Feb 15–Mar 15, 2026 for bot classification. Jan 7–Mar 30, 2026 for fees.
Disclaimer
This report is for informational purposes only and does not constitute investment advice, financial guidance, or an endorsement of Polymarket or any related product. The data and analysis are based on on-chain sources believed to be accurate as of the publication date, but we make no guarantees regarding completeness or accuracy. Readers should conduct their own research before making any financial decisions.
Looking to use Dune for your company?