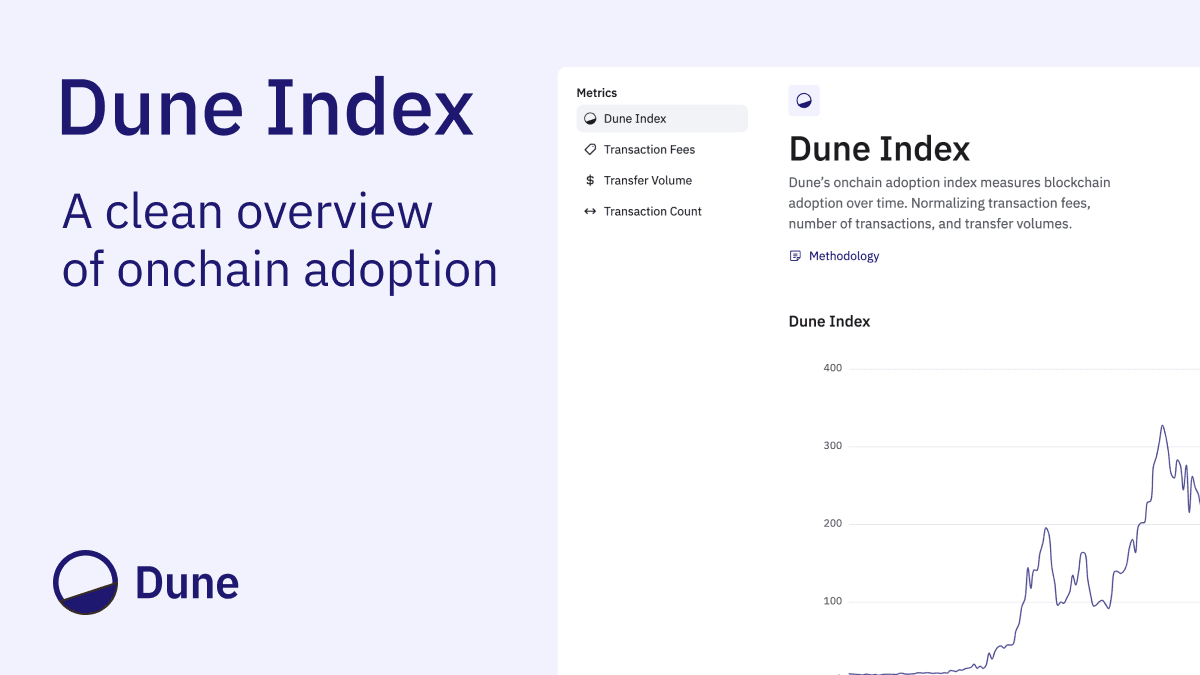
What is the Dune Index?
In the rapidly evolving world of blockchain and cryptocurrency, gauging real adoption is crucial to understanding the industry’s impact. While we often see metrics like price, active addresses, and total value locked, these don’t give the full picture of how blockchain technology is being truly utilized by people. That’s why we created the Dune Index – a comprehensive, activity-driven metric designed to measure meaningful adoption in the blockchain space.
The Dune Index brings together key metrics in a unique way, giving developers, investors, and observers an accessible, accurate way to see real traction within the blockchain industry. Instead of capturing momentary market activity, the Dune Index highlights trends that reflect genuine user engagement, helping us all understand where blockchain adoption stands and where it’s headed.

Adoption is More than Active Addresses, TVL, or Price
While it’s common to track price, active addresses, and total value locked (TVL), these metrics don’t tell us the whole story:
- Price: Price often reflects market sentiment rather than adoption. True adoption drives utility, not speculation.
- Active Addresses: Many users hold multiple addresses or create temporary addresses for specific purposes. Counting addresses can overstate user count, while the Dune Index focuses on real, consolidated activity.
- Total Value Locked (TVL): While TVL suggests capital flow, it doesn’t necessarily reflect active, productive use. A few high-value deposits can inflate TVL, masking the real utility derived from the assets.
- Transaction Count - Every transaction is a piece of blockchain activity.
- Value Transferred - Beyond the transaction itself, the value moved reflects blockchain's utility.
- Fees Paid - Blockspace isn’t free, and the fees paid tell us about the demand for network resources.
- Closer to Previous Highs in Real Terms: Today’s adoption levels are approaching highs seen in prior market peaks. However, unlike past speculative booms, today’s values reflect more genuine, utility-driven activity.
- Filtering Out Noise: During previous highs, unfiltered activity included much higher instances of net-zero transfers, showing the difference between speculative and utility-driven adoption.
- Encouraging Trends with Room to Grow: Though transaction counts and net values have grown, today’s lower gas fees mean users get more value for less cost. As blockchains scale, there’s greater potential for adoption to grow on the foundation of utility rather than speculation.


With the Dune Index, we get an unprecedented view into how each chain contributes to overall adoption. We see that while adoption during previous booms was occurring largely on the Bitcoin and Ethereum blockchains, there is a more diverse mix of platforms on which the community is operating today.


The Bottom Line
The Dune Index is not just another metric – it’s a refined, comprehensive adoption indicator that distills meaningful activity from the broader blockchain landscape. This index goes beyond price or general activity metrics, delivering insight into the industry's real growth and value creation.
We encourage you to explore the Dune Index and stay tuned as we continue tracking adoption. Watch how real blockchain adoption grows, backed by robust data and powerful analytics, and see where this technology is truly making an impact.
For daily insights, check out the Dune Index on our platform and stay updated on how blockchain adoption evolves.